
One of the most common sources of bugs (at least of my bugs) is math. I have been working on dynamically resizing a View the past days, and it was driving me nuts! I needed to consider preserving aspect ratio, device density, original view size, etc etc. Math is hard guys!
Thankfully, Android Studio has a bunch of tools that can help us make debugging stuff like this a little less painful.
The debug tool window is your friend

The debug tool widnow shows you a TON of helpful information when stopped at a particular breakpoint. On the left, you can see all the calls that were done until you arrive at a particular breakpoint. Clicking on one of those will open the corresponding file and show you the exact line. A gif paints a thousand words so here you go:
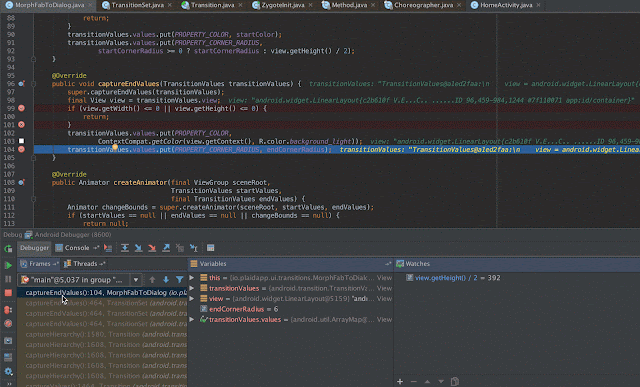
The second pane shows you all variables in the currently selected file. This means that if you step through the method calls as described above, the displayed variables will change depending on that file. If you want to further inspect properties of a variable, you can expand that and do a deeper dive (this for instance, will show all inherited fields as well).
More inspection options
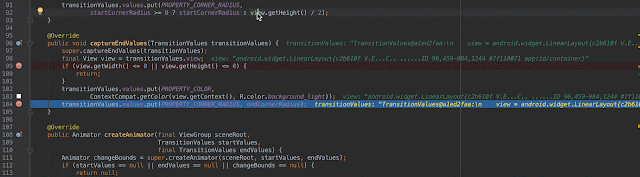
One thing I love about Android Studio is that it shows you inline some pretty useful information about a variable.

Here I can see that view is a LinearLayout, among other things. If you want to further inspect the properties of this view, you can either (1) go through the variable pane as described above, or (2) look at the params directly from that line of code.
I find Option 2 more appealing since I have more context on what I was trying to do with this variable, and if I did anything to it before or after a specific line of code. Here’s option 2 in action:
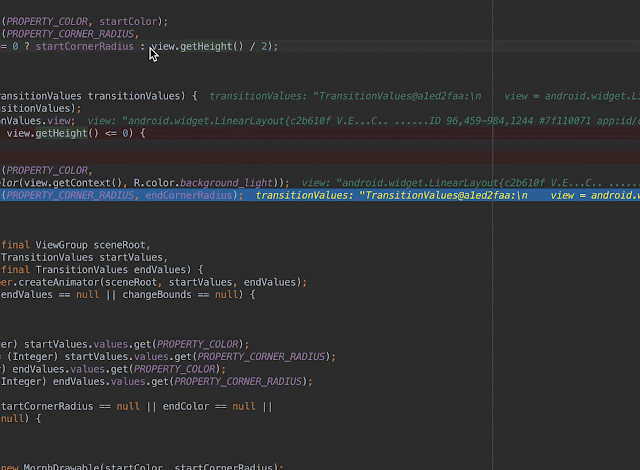
Hover over the variable of interest then click on the + all the way to the left (Or ⌘+F1) then inspect to your heart’s content.
Doing things with what we inspected
Now that we know what properties the variable we are interested in has, it’s time to actually look at what we are doing with those properties. Say you are trying to arrive at a value that will depend on the height of this view. You do some basic math:
view.getHeight() / 2
You can ask Android Studio to tell you what that resolves into by asking it to evaluate the expression. Highlight interesting expression, right click, choose Evaluate Expression (alternative: highlight expression then ⌥+F8). Studio will then show you a pop up with the selected expression; you can edit the expression here as you wish. Once ready, click Evaluate and you can now see what the result would have been if this expression was actually ran.
Most of the time, however, we are not interested in computing values on the fly. We know what variable we are interested in, we know if there’s any property of that variable we wanted to look at, and we know that we are doing some (possibly weird) math. This is when Watches become extremely useful. If you paid close attention to the Evaluate Expression gif, you would have noticed that there’s a tiny footnote below the expression text: Use Control+Shift+Enter to add to Watches.
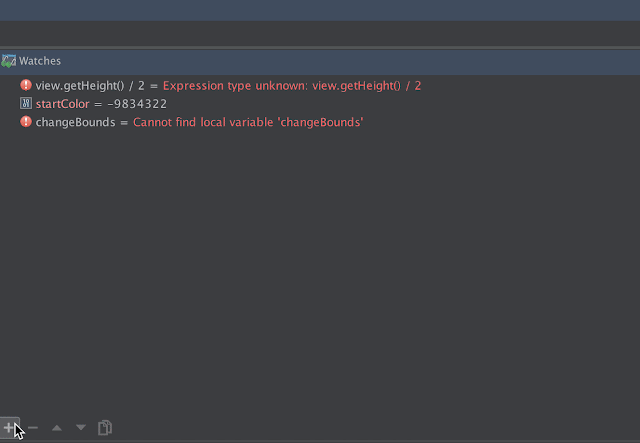
Watches
Watches is that unassuming pane all the way to the right of the debug tool window in the very first screenshot. Here you can add any number of variables and expressions and the Watches pane will resolve them all for you in the context of the current frame (Patience grasshopper, you will soon know what this means).
One way to add watches is to evaluate an expression and use the shortcut as hinted above. Another way is to highlight the expression then choose Add to Watches from the context menu. Once added you can see the expression and the evaluated value immediately in the Watches pane.
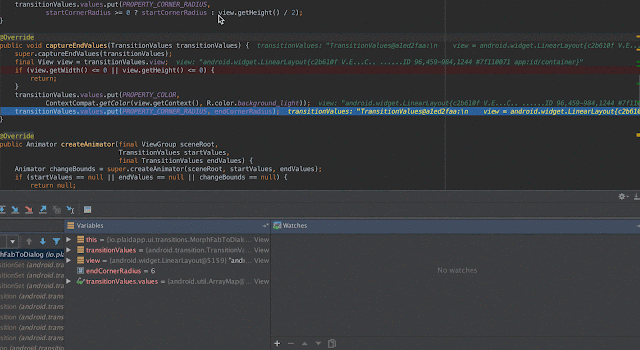
You can also manually add a Watched value by clicking on the + in the Watches pane itself. The cool thing about doing it manually? Autocomplete!!
The amazing thing and most useful thing about Watches is that the values are updated as you step through the code AND are retained across debugging sessions.

Once I step through the code (F8), the expressions in Watches are updated within the current frame’s context. Notice how initially changeBounds is undefined? Step over until we hit the assignment and the value we are watching is updated.
TL;DR?
My favourite reasons for loving Watches:
- I do not have to
TimberorToastorLogall the expressions I am interested in - Evaluated expressions, but lots of them
- No need to re-add when looking at particularly nasty bugs
- Quick and easy way to view results by changing expressions on the fly
There are a LOT more ways of maximising your mileage with Watches, so head on over to the IntelliJ blog to read all about them!
PS: Clicking on the images/gifs to embiggen should work (I hope)!